Extending the Web Debug Toolbar
by Ryan Weaver
By default, symfony's web debug toolbar contains a variety of tools that assist with debugging, performance enhancement and more. The web debug toolbar consists of several tools, called web debug panels, that relate to the cache, config, logging, memory use, symfony version, and processing time. Additionally, symfony 1.3 introduces two additional web debug panels for view information and mail debugging.

As of symfony 1.2, developers can easily create their own web debug panels and add them to the web debug toolbar. In this chapter we'll setup a new web debug panel and then play with all the different tools and customizations available. Additionally, the ac2009WebDebugPlugin contains several useful and interesting debug panels that employ some of the techniques used in this chapter.
Creating a New Web Debug Panel
The individual components of the web debug toolbar are known as web debug panels and are special classes that extend the ~sfWebDebugPanel~ class. Creating a new panel is actually quite easy. Create a file named sfWebDebugPanelDocumentation.class.php in your project's lib/debug/ directory (you'll need to create this directory):
// lib/debug/sfWebDebugPanelDocumentation.class.php
class acWebDebugPanelDocumentation extends sfWebDebugPanel
{
  public function getTitle()
  {
    return '<img src="/images/documentation.png" alt="Documentation Shortcuts" height="16" width="16" /> docs';
  }

  public function getPanelTitle()
  {
    return 'Documentation';
  }

  public function getPanelContent()
  {
    $content = 'Placeholder Panel Content';

    return $content;
  }
}
At the very least, all debug panels must implement the getTitle(), getPanelTitle() and getPanelContent() methods.
-
~
sfWebDebugPanel::getTitle()~: Determines how the panel will appear in the toolbar itself. Like most panels, our custom panel includes a small icon and a short name for the panel. -
~
sfWebDebugPanel::getPanelTitle()~: Used as the text for theh1tag that will appear at the top of the panel content. This is also used as thetitleattribute of the link tag that wraps the icon in the toolbar and as such, should not include any html code. -
~
sfWebDebugPanel::getPanelContent()~: Generates the raw html content that will be displayed when you click on the panel icon.
The only remaining step is to notify the application that you want to include the new panel on your toolbar. To accomplish this, add a listener to the debug.web.load_panels event, which is notified when the web debug toolbar is collecting the potential panels. First, modify the config/ProjectConfiguration.class.php file to listen for the event:
// config/ProjectConfiguration.class.php
public function setup()
{
  // ...

  $this->dispatcher->connect('debug.web.load_panels', array(
    'acWebDebugPanelDocumentation',
    'listenToLoadDebugWebPanelEvent'
  ));
}
Now, let's add the listenToLoadDebugWebPanelEvent() listener function to acWebDebugPanelDocumentation.class.php in order to add the panel to the toolbar:
// lib/debug/sfWebDebugPanelDocumentation.class.php
public static function listenToLoadDebugWebPanelEvent(sfEvent $event)
{
  $event->getSubject()->setPanel(
    'documentation',
    new self($event->getSubject())
  );
}
That's it! Refresh your browser and you'll instantly see the result.

As of symfony 1.3, a
sfWebDebugPanelurl parameter can be used to automatically open a particular web debug panel on page load. For example, adding?sfWebDebugPanel=documentationto the end of the url would automatically open the documentation panel we just added. This can become quite handy while building custom panels.
The Three Types of Web Debug Panels
Behind the scenes, there are really three different types of web debug panels.
The Icon-Only Panel Type
The most basic type of panel is one that shows an icon and text on the toolbar and nothing else. The classic example is the memory panel, which displays the memory use but does nothing when clicked on. To create an icon-only panel, simply set your getPanelContent() to return an empty string. The only output of the panel comes from the getTitle() method:
public function getTitle()
{
  $totalMemory = sprintf('%.1f', (memory_get_peak_usage(true) / 1024));

  return '<img src="'.$this->webDebug->getOption('image_root_path').'/memory.png" alt="Memory" /> '.$totalMemory.' KB';
}

public function getPanelContent()
{
  return;
}
The Link Panel Type
Like the icon-only panel, a link panel consists of no panel content. Unlike the icon-only panel, however, clicking on a link panel on the toolbar will take you to a url specified via the getTitleUrl() method of the panel. To create a link panel, set getPanelContent() to return an empty string and add a getTitleUrl() method to the class.
public function getTitleUrl()
{
  // link to an external uri
  return 'http://www.symfony-project.org/api/1_3/';

  // or link to a route in your application
  return url_for('homepage');
}

public function getPanelContent()
{
  return;
}
The Content Panel Type
By far, the most common type of panel is a content panel. These panels have a full body of html content that is displayed when you click on the panel in the debug toolbar. To create this type of panel, simply make sure that the getPanelContent() returns more than an empty string.
Customizing Panel Content
Now that you've created and added your custom web debug panel to the toolbar, adding content to it can be done easily via the getPanelContent() method. Symfony supplies several methods to assist you in making this content rich and usable.
~sfWebDebugPanel::setStatus()~
By default, each panel on the web debug toolbar displays using the default gray background. This can be changed, however, to an orange or red background if special attention needs to be called to some content inside the panel.

To change the background color of the panel, simply employ the setStatus() method. This method accepts any priority constant from the sfLogger class. In particular, there are three different status levels that correspond to the three different background colors for a panel (gray, orange and red). Most commonly, the setStatus() method will be called from inside the getPanelContent() method when some condition has occurred that needs special attention.
public function getPanelContent()
{
  // ...

  // set the background to gray (the default)
  $this->setStatus(sfLogger::INFO);

  // set the background to orange
  $this->setStatus(sfLogger::WARNING);

  // set the background to red
  $this->setStatus(sfLogger::ERR);
}
~sfWebDebugPanel::getToggler()~
One of the most common features across existing web debug panels is a toggler: a visual arrow element that hides/shows a container of content when clicked.

This functionality can be easily used in the custom web debug panel via the getToggler() function. For example, suppose we want to toggle a list of content in a panel:
public function getPanelContent()
{
  $listContent = '<ul id="debug_documentation_list" style="display: none;">
    <li>List Item 1</li>
    <li>List Item 2</li>
  </ul>';

  $toggler = $this->getToggler('debug_documentation_list', 'Toggle list');

  return sprintf('<h3>List Items %s</h3>%s',  $toggler, $listContent);
}
The getToggler takes two arguments: the DOM id of the element to toggle and a title to set as the title attribute of the toggler link. It's up to you to create the DOM element with the given id attribute as well as any descriptive label (e.g. "List Items") for the toggler.
~sfWebDebugPanel::getToggleableDebugStack()~
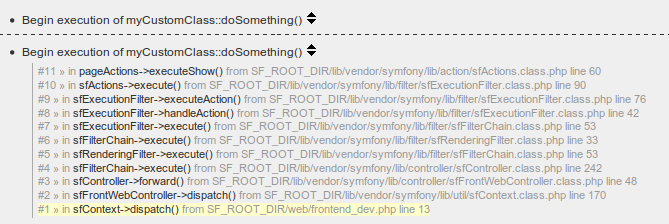
Similar to getToggler(), getToggleableDebugStack() renders a clickable arrow that toggles the display of a set of content. In this case, the set of content is a debug stack trace. This function is useful if you need to display log results for a custom class. For example, suppose we perform some custom logging on a class called myCustomClass:
class myCustomClass
{
  public function doSomething()
  {
    $dispatcher = sfApplicationConfiguration::getActive()
      ->getEventDispatcher();

    $dispatcher->notify(new sfEvent($this, 'application.log', array(
      'priority' => sfLogger::INFO,
      'Beginning execution of myCustomClass::doSomething()',
    )));
  }
}
As an example, let's display a list of the log messages related to myCustomClass complete with debug stack traces for each.
public function getPanelContent()
{
  // retrieves all of the log messages for the current request
  $logs = $this->webDebug->getLogger()->getLogs();

  $logList = '';
  foreach ($logs as $log)
  {
    if ($log['type'] == 'myCustomClass')
    {
      $logList .= sprintf('<li>%s %s</li>',
        $log['message'],
        $this->getToggleableDebugStack($log['debug_backtrace'])
      );
    }
  }

  return sprintf('<ul>%s</ul>', $logList);
}

Even without creating a custom panel, the log messages for
myCustomClasswould be displayed on the logs panel. The advantage here is simply to collect this subset of log messages in one location and control its output.
~sfWebDebugPanel::formatFileLink()~
New to symfony 1.3 is the ability to click on files in the web debug toolbar and have them open in your preferred text editor. For more information, see the "What's new" article for symfony 1.3.
To activate this feature for any particular file path, the formatFileLink() must be used. In addition to the file itself, an exact line can optionally be targeted. For example, the following code would link to line 15 of config/ProjectConfiguration.class.php:
public function getPanelContent()
{
  $content = '';

  // ...

  $path = sfConfig::get('sf_config_dir') . '/ProjectConfiguration.class.php';
  $content .= $this->formatFileLink($path, 15, 'Project Configuration');

  return $content;
}
Both the second argument (the line number) and the third argument (the link text) are optional. If no "link text" argument is specified, the file path will be shown as the text of the link.
Before testing, be sure you've configured the new file linking feature. This feature can be setup via the
sf_file_link_formatkey insettings.ymlor via thefile_link_formatsetting in xdebug. The latter method ensures that the project isn't bound to a specific IDE.
Other Tricks with the Web Debug Toolbar
For the most part, the magic of your custom web debug panel will be contained in the content and information you choose to display. There are, however, a few more tricks worth exploring.
Removing Default Panels
By default, symfony automatically loads several web debug panels into your web debug toolbar. By using the debug.web.load_panels event, these default panels can also be easily removed. Use the same listener function declared earlier, but replace the body with the removePanel() function. The following code will remove the memory panel from the toolbar:
public static function listenToLoadDebugWebPanelEvent(sfEvent $event)
{
  $event->getSubject()->removePanel('memory');
}
Accessing the Request Parameters from a Panel
One of the most common things needed inside a web debug panel is the request parameters. Say, for example, that you want to display information from the database about an Event object in the database based off of an event_id request parameter:
$parameters = $this->webDebug->getOption('request_parameters');
if (isset($parameters['event_id']))
{
  $event = Doctrine::getTable('Event')->find($parameters['event_id']);
}
Conditionally Hide a Panel
Sometimes, your panel may not have any useful information to display for the current request. In these situations, you can choose to hide your panel altogether. Let's suppose, in the previous example, that the custom panel displays no information unless an event_id request parameter is present. To hide the panel, simply return no content from the getTitle() method:
public function getTitle()
{
  $parameters = $this->webDebug->getOption('request_parameters');
  if (!isset($parameters['event_id']))
  {
    return;
  }

  return '<img src="/acWebDebugPlugin/images/documentation.png" alt="Documentation Shortcuts" height="16" width="16" /> docs';
}
Final Thoughts
The web debug toolbar exists to make the developer's life easier, but it's more than a passive display of information. By adding custom web debug panels, the potential of the web debug toolbar is limited only by the imagination of the developers. The ac2009WebDebugPlugin includes only some of the panels that could be created. Feel free to create your own.
インデックス
Document Index
関連ページリスト
Related Pages
 Introduction
 Advanced Routing
 Enhance your Productivity
 Emails
 Custom Widgets and Validators
 Advanced Forms
 Extending the Web Debug Toolbar
 Advanced Doctrine Usage
 Taking Advantage of Doctrine Table Inheritance
 Symfony Internals
 Windows and symfony
 Developing for Facebook
 Leveraging the Power of the Command Line
 Playing with symfony's Config Cache
 Working with the symfony Community
 Appendix A - JavaScript code for sfWidgetFormGMapAddress
 About the Authors
 Appendix B - Custom Installer Example
 Appendix C - License

日本語ドキュメント
Japanese Documents
 2011/01/18 Chapter 17 - Extending Symfony
 2011/01/18 The generator.yml Configuration File
 2011/01/18 Les tâches
 2011/01/18 Emails
 2010/11/26 blogチュートリアル(8) ビューの作成


